Summary of the 2018 Gateway Riders Events and Event Points:
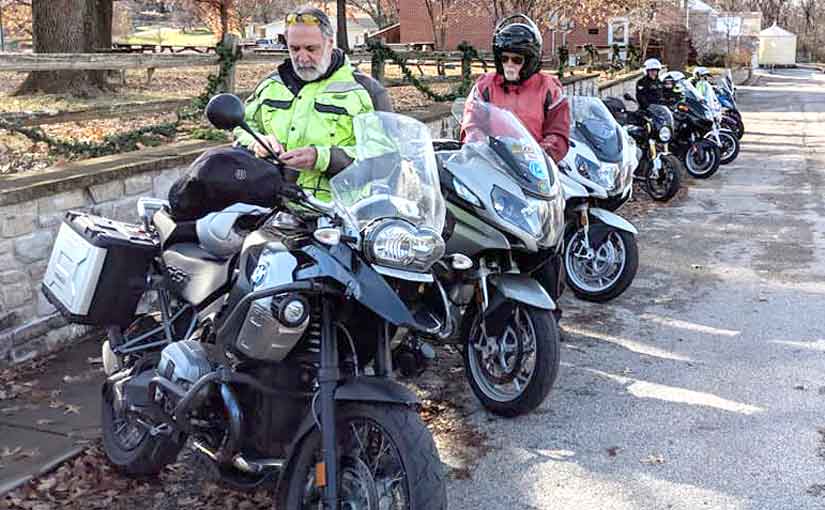
![]() While the emphasis of the club is, obviously, on riding motorcycles, there has been a lot of hard work done by many of our members to make the wide variety of club events held this year possible. As usual, we had a number of “traditional” recurring events, like the rides to St. John Gildehaus and St. Patrick’s in Ruma for their church dinners. We have also tried to expand the season a little by scheduling some December rides the last five years.
While the emphasis of the club is, obviously, on riding motorcycles, there has been a lot of hard work done by many of our members to make the wide variety of club events held this year possible. As usual, we had a number of “traditional” recurring events, like the rides to St. John Gildehaus and St. Patrick’s in Ruma for their church dinners. We have also tried to expand the season a little by scheduling some December rides the last five years.
This article briefly summarizes the club activities for the last year. The 2018 season started with last year’s Christmas party (Dec. 2017) and ended with Jim Shaw’s ride to Forever Endeavors Christmas open house. It is good to see the club has a number of newer members that are going on many of the rides.
We had 37 local club rides this year, counting the tech session, that someone went on and I got an attendance roster for while we had 41 last year and 38 the year before. There were 42 rides scheduled this year but 5 were cancelled (or rescheduled) due to weather. However I typically give credit to the ride leader or anyone that shows up at the start of a cancelled ride. Several of the cancelled rides were rescheduled for later in the season and are part of the 37 rides that went. The number of cancellations this year, 5, was up from last year’s 3 cancelled rides.
 Ride leaders showed some flexibility again this year. Jeff took over Marilyn’s (Al’s) leisurely ride to Hermann when she and Bill had to get ready to host the main course of the Progressive Dinner the next day at the last minute. Jim Shaw led a group for the last ride of the season on a scenic loop ending at Forever Endeavour’s Christmas Open House.
I listed fewer “out of town” rallies this year, 11 vs. 12 last year, while I consider our Falling Leaf a local rally. Someone attended 10 of the 11 listed out of town rallies this year. I also give credit for rallies that aren’t specifically listed and we had a few members attend some of these other rallies (however, attendance at these rallies isn’t included in the average). One or more members attended several rallies that I didn’t list like the “Great River Road Rally” in southwest Wisconsin. Average attendance at the listed rallies declined 10% this year, to 5.9 as compared to last year’s 6.6. However, attendance at the MOA National in Des Moines was back up to a more typical number (20) for a National within a day’s ride. Last year, only 4 members attended the National in Salt Lake City, as compared to 23 members attended the National in Hamburg, NY in 2016. The MOA has finally gotten the message about having National’s during the hottest time of the year and is going to Lebanon, TN in mid-June in 2019. The Gateway Riders did win largest club at the RAMS rally again this year (for the third year in a row) with 6 members in 2018 (vs. 11 in 2017). Unfortunately, it is my observation that rally attendance in general appears to be declining at many/most of the Midwest rallies (your Event’s Director attended 11 rallies this year and 9 in each of the 4 previous years). It appears that age is catching up with a number of previous “rally rats”, restricting or eliminating their attendance. The long term linear trend for Gateway Rider average attendance at other club’s listed rallies has fallen from slightly over 10 in 2005 to about 7 in 2015 with 5.9 actual average attendance in 2018.
In addition to scheduled events, we had a number of impromptu rides this year with Phil or others often sending out a “let’s go riding note” or several different members posting on Facebook for nice days. Since Phil is retired, he isn’t restricted to weekends anymore but was out of town a bit more this year than last year. This has led to him leading less scheduled rides but he makes up for it with impromptu rides.
The average ride attendance was down significantly this year, 25% to 7.0, as compared to the previous two years when it was over 9 (9.4 in ’17 and 9.2 in ’16). Average party attendance was similar to last year (up 2%) while meeting attendance was down slightly (6%) as compared to 2017. In general though, the average party attendance had been going up for several years before falling last year. We had 5 club sponsored parties again this year, with the Christmas party and the pool party the best attended. Marilyn arranged for the Super Bowl party to again be at the Schroer’s, in memory of Al, after a suggestion from Jill and Liz Schroer. Diana Votow, a newer member, hosted the St. Pat’s day party this year with Phil Sulfstede helping her by cooking the corn beef. In addition, we also had the hot dog roast the week after the Falling Leaf rally, which I have treated as a club ride (like the progressive dinner) rather than as a party.
We had 10 general meetings (excluding the Pool Party meeting), and the 43nd Falling Leaf rally this year. Having a December general meeting separate from the Holiday party was something we also did this year. Average meeting attendance was down 6% this year.
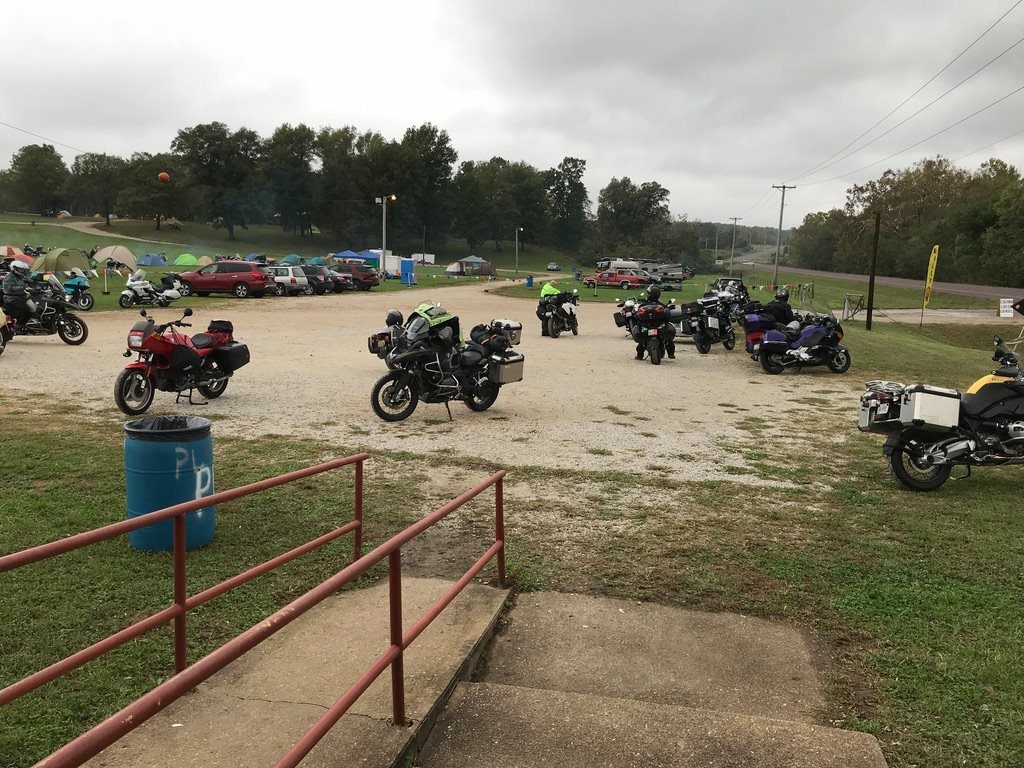 The weather for the Falling Leaf Rally was poor this year with rain on Friday, and late Saturday afternoon. Attendance was down to 307 this year (as compared to 478 in ’17 and 486 in ’16). However, this is pretty similar to the about 300 attendees we had in both 2009 and 2014, the last two times it rained for the rally. However, more Gateway Riders attended this year, 50, as compared to 44 last year. Though, there were also 50 Gateway Rider’s at our rally in 2016.
A summary of attendance at the various types of events is given in the table below along with the best attended (maximum attendance) for each type of event: meetings, rides, and parties.
The Progressive Dinner and Christmas party remained the most popular ride and party, as they have been for more than the last ten years. The Christmas party was the most attended event with 54 (48 members and 6 guests). This was down 18%, from 66 in 2017. Progressive Dinner attendance was also down this year, with 37 members attending vs. 43 in 2017. The best attended meeting was back to the spring with 37 at the April meeting and 36 at the May meeting. Surprisingly, January was the best attended meeting in 2017.
Three sets of average and maximum attendance numbers are shown below. All these averages don’t include the cancelled rides, or, those rallies and rides for which I didn’t get a roster (i.e. the averages only include events someone actually attended). There were 5 cancelled rides this year and one listed rally which had no attendance or roster. They are based on members only, and don’t include guests. We typically have one to several guests at each event, so total attendance is even higher than shown here.
The first set of average and maximum attendance is calculated on the 37 local club rides including the technical session but doesn’t include out of town rallies. The second set includes the 37 rides plus 10 “out of town” rallies I listed (the Falling Leaf isn’t in the average because it would distort the numbers).
The third set shows the attendance average for just the 10 “out of town” rallies I listed (again, without the Falling Leaf, which would distort the numbers).
Attendance Summary:
| Event Type | 2018 Average Attendance | 2017 Average Attendance | 2018 Maximum
Attendance |
Most Attended Event in ‘18 | 2017 Maximum
Attendance |
| Rides (w/o rallies)
Rides plus rallies (except Falling Leaf)) |
7.0 – down 25%
6.8 – down 26% |
9.4
9.2 |
37
+ 3 guests |
Ride: Progressive Dinner | 43
Prog. Dinner |
| Listed Rallies (w/o Falling Leaf) | 5.9 – down 10% | 6.6 | 20 | MOA National | 11 (Land of Oz and RAMS) |
| Parties | 27.0 – up 2% | 26.4 | 48 + 6 guests | Christmas; (largest event) | 55 + 11 guests |
| Meetings | 29.4 – down 6% | 31.4 | 37 |
April
|
37
(Jan. in ’17) |
| Falling Leaf | 50 | 44 |
Local ride attendance was down significantly this year, 25%, perhaps due to the weather. Fortunately, we do have a number of newer members going on many local rides. “Out of town” rally attendance was also down 10%. However, MOA National attendance was back up to more typical numbers with 20 Gateway Rider’s attending the rally in Des Moines. The club again won “Largest Club” at the RAMS rally this year, for the third year in a row but we didn’t repeat largest club at the Land of Oz rally (after winning in 2016 and 2017). I encourage everyone to think about attending more rallies next year; they are always a good time. It does appear that we are getting lots of new members and a wider mix of members on the club rides, which is good for the future of the club.
Meeting attendance was slightly down again this year (6%) and is at the lowest level in years. Party attendance was similar to last year (up 2%) after falling 27% last year. However, it had been up significantly in 2015 (10%) and 2016 (11%) before falling last year.
Overall membership at year end is similar to last year with 109 paid or life members. This compares to 107 in 2017, 118 in 2016, and 113 in 2015. About 83% of the members (90 of the 109) were active members that attended at least one event this year which is down slightly from last year which had 86% (92 of 107). The median number of events attended by the active members this year was again 6 (6 in 2017, 4 in 2016, and 6 in 2015). The average number of events attended this year by active members was similar to last year with 8.9 in 2018 and 8.7 in 2017.
Ride Leaders: These are the people who spend their time and effort to arrange, organize, facilitate, and lead rides or events. Ride leadership includes items like leading rides, collecting money at the Christmas party, hauling supplies to the hot dog roast, and similar efforts. This year we had only had 11 members get ride leader credit, which is only about 1 in 10 members. This is down significantly from last year when 16 members got ride leader credit. There were 10 in 2016, 13 in 2015, and 16 in 2014. It is good for the club to have more ride leaders, offering more destinations and riding styles for members to choose from, and it spreads out the work. If a few more members would lead just one ride it would make it easy to fill out the ride schedule every time and provide a wider variety of rides. If you don’t like the pace of the club rides or the destinations, or have a neat new destination in mind, you can solve this by leading a ride to where you want to go, at the pace you want to ride. Without the hard work of the ride leaders, we wouldn’t have the wide variety of events that we have, which is the main reason to have the club. While some rides may be a simple, straight from memory ride, like leading the group to St. John’s Gildehaus, others take hours of planning and preparation to organize and execute like Jon Diaz’s “Raddle the Bottoms Bluegrass and Folk Festival” ride last fall. Jim Shaw and Jeff Ackerman were the top two ride leaders this year with Dave Anderson, Rich Leslie, and Phil Sulfstede all tied for 3rd place.
Jim Shaw really stepped up this year, leading 11 rides to a variety of destinations. And Phi Sulfstede, while leading less organized rides than usual, still did a good job organizing impromptu rides. I also want to thank all the others who led a ride or otherwise helped make an event happen this last year.
The following table shows the ride leaders for both this year and last year as well as the number of rides they led.
Ride Leaders: (people who led a ride or helped make an event happen)
| Member | Number of Rides Led ‘18 | 2018 Rank | Member | Number of Rides Led ‘17 | 2017 Rank |
| Shaw, Jim | 11 | 1 | Ackerman, Jeff | 10 | 1 |
| Ackerman, Jeff | 6 | 2 | Sulfstede, Phil | 8 | 2 |
| Anderson, Dave | 4 | 3 | Anderson, Dave | 7 | 3 |
| Leslie, Rich | 4 | 3 | Shaw, Jim | 5 | 4 |
| Sulfstede, Phil | 4 | 3 | Bissell, Dave | 2 | 5 |
| Bissell, Dave | 2 | 6 | Leslie, Rich | 2 | 5 |
| Diaz, Jon | 2 | 6 | Mattis, Dave | 2 | 5 |
| Mattis, Dave | 2 | 6 | Schroer, Al | 2 | 5 |
| Ackerman, Mary | 1 | 9 | Bissell, Cathy | 1 | 9 |
| Bissell, Cathy | 1 | 9 | Floyd, Larry | 1 | 9 |
| Roberts, Marilyn | 1 | 9 | Halbert, Mike | 1 | 9 |
| Kerckhoff, Chris | 1 | 9 | |||
| Race, Rich | 1 | 9 | |||
| Revell, John | 1 | 9 | |||
| Roberts, Marilyn | 1 | 9 | |||
| Williams, Jim | 1 | 9 |
Hosts: Being an event host garners the most points per event, 5, because it requires the most work. I really want to thank everyone that took the extra effort to serve as a host for our various club events this year. Phil Sulfstede hosted 4 events this year. Phil had two at his house, with Elaine graciously helping at both, plus he cooked the corned beef for the St. Pat’s party and brought his grill and helped BBQ at the pool party. Art Belt hosted a technical session at his house this spring with Jim Shaw’s help. The progressive dinner hosts were Sharon and Larry Floyd, Phil Sulfstede, Dave Mattis, Marilyn and Bill Roberts, and Susan and Jon Diaz. Special kudos for Marilyn and Bill for picking up the progressive dinner main course at the last minute when the Jacquin’s had to cancel for health reasons. Dave and Tracy Anderson hosted the New Year’s Eve party, Diana Votow the St. Pat’s party, and Mary and Jeff Ackerman again had the pool party for about the 20th year.
Event Points Ranking:
The table below has the top ten event point rankings for 2018 as well as statistics from last year. In general, the scores were lower this year as compared to 2017. Most of the names are similar, accounting for the fact that some just below the top ten last year climbed into the top ten this year while others just fell out. The top six places were won by the same group with their order changed slightly from last year. Jim Shaw and Jeff Ackerman placed well above the rest, with Jim winning the contest by leading the last ride of the season.
The points are a combination of the number of events attended (see the second table below) along with the credit given per event (e.g. being a host at 5 points is worth 2 ½ rides at 2 points). One change this year, is that no points were given for gazette articles, like in previous years, since we discontinued the gazette with the February 2017 issue.
Jim Shaw took over first place this year by scoring 7 more points than last year. A big portion of this was the fact that he led 11 rides this year (about 30% of the 37 club total). Jeff Ackerman fell to second place this year after winning the 3 previous years. Jeff attended more events this year than Jim but Jim earned his win by leading the most rides. Rich Leslie, who is now leading many rides climbed into 3rd place. Phil Sulfstede, the perennial winner for a number of years in the past fell to 4th place because he is travelling much more now that he is retired. Jay Green finished in 5th place by attending both a large number of rides and rallies. Poor Dave Anderson fell from 3rd place last year to 6th place because he has to spend a lot of time at work. A problem the retirees don’t have. The rest of the top ten are listed in the table. Mary Ackerman and Cathy Bissell, tied for 11th place overall, were the top two finishing women this year.
Event Points Ranking:
| Member: | Rank 2018 | Points 2018 | Member: | Rank 2017 | Points 2017 |
| Shaw, Jim | 1 | 94 | Ackerman, Jeff | 1 | 101 |
| Ackerman, Jeff | 2 | 91 | Shaw, Jim | 2 | 87 |
| Leslie, Rich | 3 | 65 | Anderson, Dave | 3 | 81 |
| Sulfstede, Phil | 4 | 59 | Leslie, Rich | 4 | 70 |
| Green, Jay | 5 | 53 | Sulfstede, Phil | 4 | 70 |
| Anderson, Dave | 6 | 50 | Green, Jay | 6 | 68 |
| Bissell, Dave | 7 | 42 | Maples, Bob | 7 | 51 |
| Haugen, Bill | 8 | 39 | Leligdon, Dave | 8 | 47 |
| Mattis, Dave | 9 | 35 | Mattis, Dave | 9 | 38 |
| Murray, Ron | 9 | 35 | Graham, Bill | 10 | 36 |
Events Attended Ranking: Number of club events (including rallies) attended by the member.
About 83% of the members (90 of the 109) were active members that attended at least one event this year which is down slightly from last year which had 86% (92 of 107). The median number of events attended by the active members this year was again 6 (6 in 2017, 4 in 2016, and 6 in 2015). This means that half of the 90 active members attended 6 or more events this year while half attended less than 6. The average number of events attended this year by active members was similar to last year with 8.9 in 2018 and 8.7 in 2017.
The events attended rankings were mostly similar to last year, with some moving up slightly and some moving down slightly. The difference between points and number of events attended shows the impact of being a host and ride leader on the final point count. Jeff Ackerman was first again this year in number of events attended by attending 44 events again this year. This yielded 10 less events points than last year because he led less rides and took the car to more events and didn’t publish any gazette articles. Jim Shaw was second again this year by attending 41 events again this year. However, by leading more rides and helping host the tech session, he garnered more events points from the same number of events. Phil Sulfstede attended fewer events than Jay Green but finished higher in the points count by being host four times. Dave Anderson, at 11th, fell just out of the top ten in number of events attended but did well in events points, 6th, by being a host and leading rides.
See the table that follows for a listing of the number of events attended this year and last year.
Events Attended Ranking:
| Member 2018 | Number of
Events in 2018 |
2018 Rank | Member 2017 | Number of
Events in 2017 |
2017 Rank |
| Ackerman, Jeff | 44 | 1 | Ackerman, Jeff | 44 | 1 |
| Shaw, Jim | 41 | 2 | Anderson, Dave | 41 | 2 |
| Leslie, Rich | 35 | 3 | Shaw, Jim | 41 | 2 |
| Green, Jay | 29 | 4 | Leslie, Rich | 38 | 4 |
| Sulfstede, Phil | 25 | 5 | Green, Jay | 35 | 5 |
| Haugen, Bill | 24 | 6 | Sulfstede, Phil | 29 | 6 |
| Bissell, Dave | 24 | 6 | Maples, Bob | 25 | 7 |
| Bissell, Cathy | 22 | 8 | Leligdon, Dave | 24 | 8 |
| Mattis, Dave | 22 | 8 | Mattis, Dave | 22 | 9 |
| Murray, Ron | 22 | 8 | Murray, Ron | 20 | 10 |
Overall, the club did OK this year with the different number of events, considering that attendance was significantly down on local rides this year. Hopefully attendance will pick back up again next year. With the MOA rally in Lebanon, TN next June and the RA rally in Virginia next September, there will be some great riding opportunities at the national rallies when the weather should be cooler than mid-July. Jeff Ackerman and Jim Shaw have been the top two point scorers the last three years after Phil Sulfstede (1st) and Jeff (2nd) held the top two spots for a number of the previous years. Jeff and Jim are riding more locally since retirement and are also attending more rallies since retirement. Phil is taking advantage of retirement to spend more time travelling and in Louisiana. Dave Anderson and Rich Leslie have been helpful by stepping up and starting to lead a number of rides the last couple years. Having a few more members follow their lead and step up and lead some rides would make filling the events calendar easier and give us a wider variety of rides.
A bright spot for the club is that we continue to have an influx of new members joining the club. Many of them are attending a number of events including rides. Hopefully, we will see the newer members on the leader list in the near future and can get them to organize and lead some new rides.
I look forward to seeing all of you on a number of the club rides in 2019. After 23 years as your Events Director, I have decided to retire from the position. Please remember to support your new Events Director with your next ride and/or event ideas. Please let him or her know and he or she will get you on the ride schedule. If you have never led a ride, please consider leading just one ride next year. That will be your opportunity to go to just the destination you want at the pace you like. If a number of members step up and do this, it will make the new Events Director’s job much easier.
Respectfully submitted;
Jeff Ackerman
(Retiring) Gateway Riders Events Director
December 15, 2018